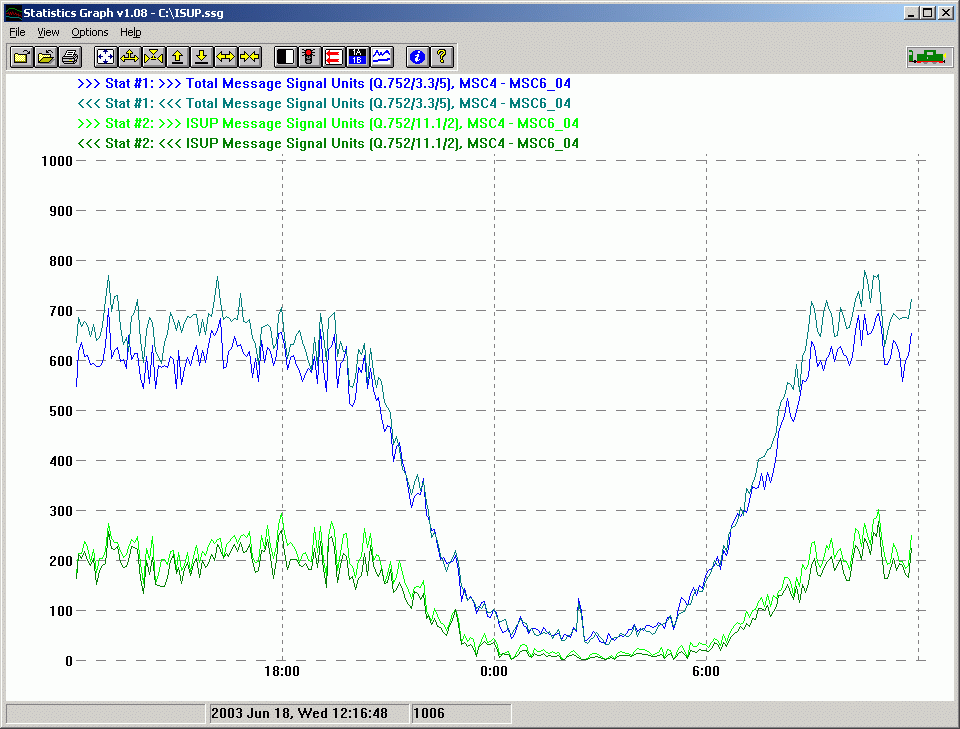
| Menu
| Menuitem
| Shortcut(s)
| Meaning
|
| [File]
|
|
|
|
|
| Open a STA files
| (Ctrl-O)
| Open a statistics data file (*.STA)
|
|
| Close
| (Ctrl-C)
| Close actual file
|
|
| Export data into CSV file...
| (Ctrl-E)
| Save data from statistics data file into comma separated format
|
|
| Print in Balck&White
|
| If unchecked the print will show the original colours
|
|
| Print...
|
| View can be printed
|
|
| Exit
|
| Close the program
|
| [View]
|
|
|
|
|
| Fit to page
| *
| Fit current view to the most viewable size
|
|
| Zoom 1:1
|
| Zooms to the maximum
|
|
| Zoom in
|
| Enlarges the picture
|
|
| Zoom out
|
| Zooms out to the wide view
|
|
| Copy to clipboard
| Ctrl-Ins
| Copy plot to clipboard
|
| [Options]
|
|
|
|
|
| Invert Bg
|
| Changes background from white to black or back
|
|
| Auto refresh
|
| If a statistical data file is just written the new data automatically will be shown
|
|
| Auto scroll
|
| Allows automatic scrolling of the log screen
|
|
| Refresh now
| Ctrl-R
| Reload the statistical data file
|
|
| Choose statistics
|
| From the open file one or more statistics can be selected to be shown
|
|
| Choose a plot type
|
| Raw or avarage plottiong type can be selected
|
|
| Save settings
|
| Saves actual settings into the configuration (StatGrph.ini) file
|
| [Help]
|
|
|
|
|
| Show info
| Ctrl-F1
| Shows information from opened statistical data file
|
|
| Help
| F1
| Help is unavailable. Check this document.
|

